

DET NORSKE VERITAS
ERS DRIFT
1 Designer
6 Months
DNV's Emergency Response Service (ERS) provides 24/7 shore-based emergency support to ocean vessels and offshore units. One common emergency is when ships lose their engine power and become stranded at sea; this could quickly turn into a dangerous situation when the vessel starts drifting uncontrollably due to ocean currents. Thankfully, today ocean sciences are advanced enough that computer simulation models can actually predict object drifting trajectories in real time. However, most commercial products suffer from poor user experience. This is unfortunate as the maritime industry as a whole lags behind in terms of digital transformation. Hoping to increase their response efficiency during actual emergencies, ERS came to my team at DNV Digital Solutions asking for an easy-to-use tool suitable for a variety of emergency scenarios.
In 2016, the massive cargo ship Modern Express became disabled due to heavy weather in the Atlantic Ocean. Unmanned and drifting through rough seas, it was set to hit the French coast and potentially lead to environmental disaster if not stopped by maritime search and rescue services. (Source: The Guardian)
RESEARCH
用戸研究
Interviews
This project proved to be difficult from the start. As our service was billed by the hour, the clients did not want to pay for something as nebulous as “user research.” I had to reach out to the customers directly and advocate for better user experience. By building a whole new product, we had the opportunity to make the lives of both our customers as well as our own service operators a lot easier, thereby making the entire service more efficient and attractive. Through a number of interview sessions I asked the ERS clients to walk me through their daily work involving drift prediction.


User Journey
By outlining the step-by-step ERS procedure during an emergency, I traced the flow of drift prediction data as it changes hands from the API provider, to ERS, to various stakeholders in the emergency. Very quickly I realized that the biggest hindrance to user experience and operation efficiency lied not with data generation, but data sharing. Namely, the sharing of data from on-shore offices to vessel operators and search-and-rescue personnel at sea, who are likely to be working in hostile and high-stress environments. Despite such demanding conditions, most communication between the ERS and its partners was still done through phone calls, emails, and PDF documents with page after page of tables and charts.
Competitive Analysis
The design challenge now focused on finding a way to efficiently share complex trajectory data with multiple touchpoints suitable for emergency rescue. With that in mind I began competitive analysis, which also proved to be quite difficult. First, there were simply not that many competitors on the market, as drift prediction was still a very emergent and niche service. I then looked into similar products such as shipping route planners and SAR coordination tools, but even then many did not address my specific needs — and generally had poor UI.

My breakthrough came from a very unexpected source: hurricane forecast apps. Although at a glance not at all related to ship drifting, they also visualize a predicted path within a specific time period. One detail quickly caught my eye: many weather forecast apps have a time-lapse feature, with a playback bar showing animation within a set time period. This was the inspiration I'd been looking for.

IDEATION
設計構想
Design Requirements
A time-lapse animation is not only an effective way to visualize the highly complex drift prediction data, it is also easily sharable across web and mobile platforms, suitable for the type of emergency scenarios our users are likely to be engaged in. With a clear idea of the type of product we are going to build, the rest was a matter of translating the design concept into concrete requirements. Based on the list of "must-have" and "could-have" requirements, I then built out a 3-tiered proposal to present to client representatives.
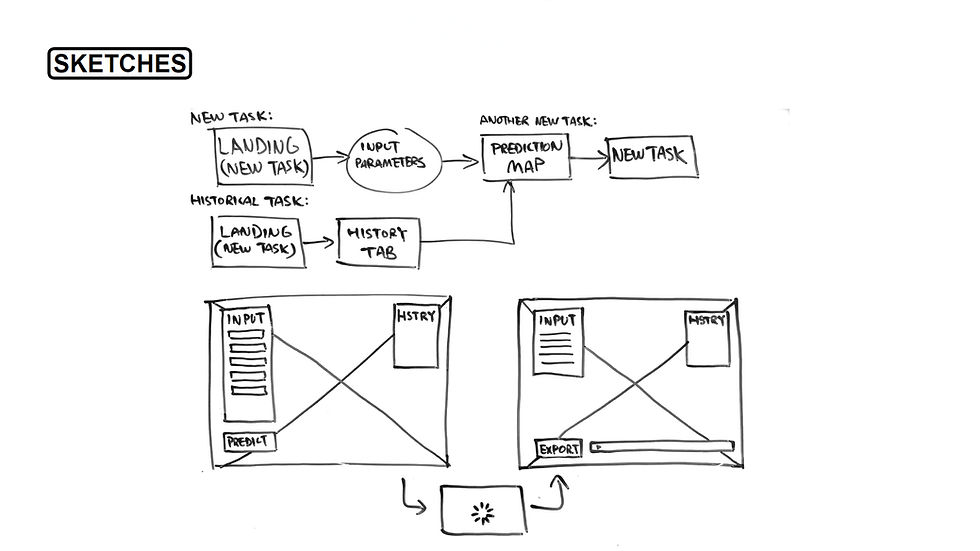
Flows & Sketches
With design requirements now finalized, I went ahead to plot out the user task flows for each requirement. I then extracted from the key tasks the functional content needed on each page of the application and sketched them out on a whiteboard. As soon as I had gathered all the necessary information, I moved on to building the prototype.

Low-fidelity Wireframes
Although each page's content had been confirmed, the specific UI still required exploration. I performed crazy-8 exercises to brainstorm different layouts, and developed some of my favourite ones into slightly more detailed mockups to present to the client representatives.
PROTOTYPE
原型制作
High-fidelity Prototype
After multiple rounds of design workshop with the client representatives and our frontend engineers, I finally built out a fully interactive prototype using UXPin.

Very soon we had a screen flow overview of the entire T-Rail app. What so far had only been abstract information had finally turned into concrete UI. Now the various stakeholders, from high-level business managers to tax team end users, could have a clear picture what we would be building. The engineering team was also able to come up with more precise effort estimation. As engineers began the backend preparations, I moved on to help with frontend design.

REFLECTION
経験総結
Overall, ERS Drift was definitely a hectic project for me as a designer. At the very beginning, trying to advocate for UX research with customers who were UX-minded was a big challenge. Later on there were some requirement changes by the customer, so I had to coordinate very closely with the project manager and engineers to ensure minimal disruption to their development work while drafting new designs. Initially we were also missing a frontend engineer on the team so I often found myself having to jump in and help on the CSS.
Ultimately though, we were very successful with the final delivery. A company-wide internal demo was held in Norway, and the product was very well received by the customer. The new tool is able to greatly automate ERS’s prediction reporting workflow, bringing what used to be almost half an hour of manual compiling down to as fast as 2 minutes. ERS Drift is now being used by DNV to support more than 5,000 registered vessels worldwide.
